

Driver reaction time
Driver Reaction Time and Safe Driving Distances
Understanding how reaction time affects stopping and safety distances is essential for safe driving. According to the Portuguese Highway Code, drivers must maintain adequate time and distance to respond to unforeseen obstacles. This article explains the key principles, examples, and calculations every responsible driver should know.
What is Driver Reaction Time?
Reaction time is how long it takes a driver to notice danger and start to respond. It begins the moment something unexpected happens — like a child running into the road — and ends when the driver starts to press the brake or move the steering wheel.
Reaction time has three quick stages:
- Seeing the danger – your eyes notice that something is wrong;
- Thinking what to do – your brain decides how to react;
- Starting to act – your body begins to move and take action.
But it can take longer if the driver is tired, distracted, has been drinking, or is under stress. No one can react instantly — every person needs a short moment to understand and respond to what they see.
During this one-second interval, the vehicle continues moving at its current speed, covering what is called the reaction distance.
Factors That Increase Reaction Time
- Limited driving experience
- Older age
- Fatigue or sleepiness
- Physical or mental impairment
- Use of certain medications
- Influence of alcohol or drugs
Note: Reaction time never decreases — it can only increase under these conditions.
Reaction, Braking, and Stopping Distances
1. Reaction Distance
The reaction distance is how far your car moves during that short time before you actually press the brake. Even though you see the danger, the car keeps moving at the same speed until you begin to slow down.
The faster you drive, the more distance you cover while reacting. You can use a simple idea:
Example: If you drive at 90 km/h (about 25 metres per second) and it takes 1 second to react, your car will travel about 25 metres before braking starts. That's almost the length of five cars! This shows why keeping a safe distance from the vehicle ahead is so important.
2. Braking Distance
Once the brakes are applied, the vehicle does not stop immediately. The braking distance depends on:
- Vehicle speed
- Tyre and brake condition
- Vehicle load
- Road surface and slope
For simplicity, the Portuguese Highway Code uses a quick estimation:
Example 1:
At 47 km/h,
Identifying the digit in the tens place: the tens digit of 47 is → 4.
Multiply the tens digit by itself: 4 → 4 × 4 = 16 metres of braking distance.
So, in this example, the digit in the tens place is 4, and multiplying it by itself gives us 16. Means if we have a vehicle having speed of 47 kilometre per hour then the braking distance will be 16 metre.
Example 2:
At 92 km/h,
Identifying the digit in the tens place: the tens digit of 92 is → 9.
Multiply the tens digit by itself: 9 → 9 × 9 = 81 metres of braking distance.
3. Stopping Distance
The stopping distance is the total distance travelled between the moment the driver sees the obstacle and the moment the vehicle stops.
Calculating a vehicle's stopping distances at various speeds. Let's see the table. For the calculation we assume the reaction time is 1 second. And Breaking Distance = square of the digit of the tens of the speed.
Sample Calculations
| Speed (km/h) | Reaction Distance (m) | Braking Distance (m) | Total Stopping Distance (m) |
|---|---|---|---|
| 40 | 11 | 16 | 27 |
| 80 | 22 | 64 | 86 |
| 120 | 33.5 | 144 | 177.5 |
Kinetic Energy and Tyre Grip
Kinetic energy is the energy an object has because it is moving. The faster a vehicle moves, or the heavier it is, the more kinetic energy it has. This energy is what must be overcome to make the vehicle stop.
When you press the brakes, the car's brakes and tyres work together to remove this energy by friction. The more kinetic energy the car has, the longer it takes to stop and the more heat the brakes must handle.
Formula
The amount of kinetic energy can be found with this formula:
where:
- m = mass of the vehicle (in kilograms)
- v = speed of the vehicle (in metres per second)
Why It Matters for Driving
Because the speed is squared in the formula, kinetic energy grows very fast when speed increases. This means that even a small increase in speed can make a big difference in stopping distance.
Example
Imagine two cars of the same weight:
- Car A travels at 50 km/h
- Car B travels at 100 km/h
Car B is going twice as fast, but its kinetic energy is four times greater (because 2² = 4). That means it needs about four times more braking distance to stop. This shows why higher speeds are so dangerous — the car carries much more energy that must be stopped.
Other Factors
The stopping distance also depends on the car's mass and the road conditions. A heavy vehicle (like a truck) has more kinetic energy than a small car at the same speed, so it needs a longer distance to stop. On wet or icy roads, tyres cannot grip well, so it takes even longer to release that energy and stop safely.
In short, the faster and heavier your vehicle is, the more energy it carries — and the harder it becomes to stop. That's why stopping is harder on downhill slopes or slippery roads.
Braking effectiveness depends on:
- Vehicle speed and weight
- Road slope
- Brake system condition
- Tyre type and wear
- Road surface quality
During rain, braking distance may increase by up to 40% due to reduced tyre grip. At the start of rain after a dry period, oil and dust create a slick film that makes roads even more dangerous.
If tyres lose grip entirely, skidding occurs. To avoid skidding, drivers should apply several short, gentle brakes instead of one strong continuous press.
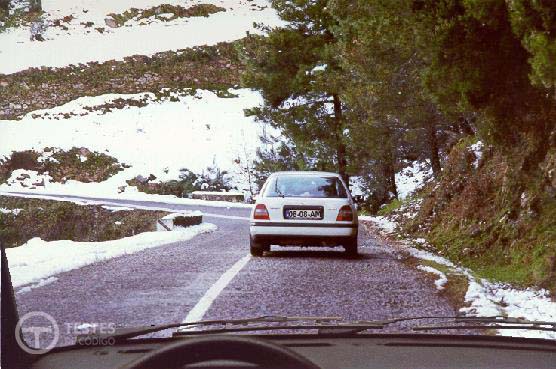
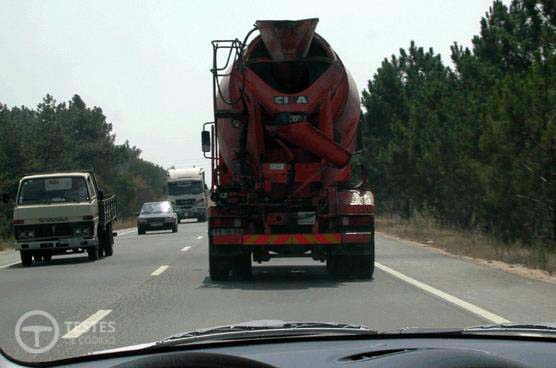
Safety Distance
The safety distance is the space a driver must keep from the vehicle in front. It gives enough time to react and stop safely if something unexpected happens — for example, if the car ahead brakes suddenly or an obstacle appears on the road.
This distance depends on your speed. The faster you drive, the more distance you need. It should always be big enough so that, if the vehicle in front stops suddenly, you can stop without crashing into it.
How It's Calculated in Portugal
In Portugal, the rule is based on time, not metres. Drivers should keep at least a 2-second gap from the car ahead. This is called the two-second rule. To check it, choose a fixed object on the road (like a sign or a tree). When the car in front passes it, start counting: "one thousand and one, one thousand and two." If you reach the same object before finishing, you are too close.
A simple way to remember: keep at least double the reaction distance between your car and the one ahead.
Examples of Safe Distance
Here are a few examples using the two-second rule in Portugal:
| Speed (km/h) | Distance per 2 seconds (m) | Recommended Safety Distance (m) |
|---|---|---|
| 50 | ≈ 14 m/s × 2 s = 28 m | ≈ 30 m |
| 90 | ≈ 25 m/s × 2 s = 50 m | ≈ 50 m |
| 120 | ≈ 33 m/s × 2 s = 66 m | ≈ 65 m |
At highway speeds, that means keeping a gap of more than half a football field. This extra space can prevent a crash if the car ahead stops suddenly.
Extra Safety Tip
Always increase your distance when driving at night, in the rain, or on slippery roads. And when passing a cyclist, leave at least 1.5 metres of space on the side.
Lateral Safety Distance
When two vehicles travel side by side — either in the same or opposite directions — both drivers must maintain enough lateral distance to avoid side collisions. Factors to consider include:
- Road width and condition
- Vehicle size and load
- Speed
- Crosswinds
Practice Questions
Example 1
Question 3777: If the driver in front of me slows down, the safety distance:
- A: Increases
- B: Decreases
- C: Remains the same
 Credit: IMT and Testes de codigo
Answer: B — Decreases
Explanation:
In this type of question, the IMT (Institute of Mobility and Transport) wants to assess what happens when speeds change.
Imagine two vehicles travelling at 50 km/h - Vehicle A in front and Vehicle B behind:
When Vehicle A slows down and Vehicle B maintains its speed, the safety distance decreases because Vehicle B is travelling faster than the vehicle in front, gradually closing the gap between them.
Similarly, if Vehicle B increases its speed while Vehicle A maintains speed, the safety distance also decreases as Vehicle B catches up to Vehicle A.
Therefore, when the vehicle in front slows down and you maintain your speed, the safety distance between you decreases.
Example 2
Question 605: In this situation, if you can increase speed, the safety distance should:
- A: Increase
- B: Decrease
- C: Remain the same
 Credit: IMT and Testes de codigo
Answer: A — Increase
Explanation:
Unlike the previous question, here the IMT wants to assess what should happen when vehicles change speed.
Using the same example with Vehicle A in front and Vehicle B behind:
If Vehicle B increases its speed while Vehicle A maintains speed, the safety distance should increase to compensate for the longer stopping distance required at higher speeds.
Whenever speed increases, the safety distance should also increase to account for the increased stopping distance. The stopping distance always increases when speed increases.
If Vehicle A doesn't also increase speed, then Vehicle B should either overtake or reduce speed again to match Vehicle A's speed.
Therefore, when increasing speed, you should also increase your safety distance to maintain safe driving conditions.
Safety Distance Summary
Using the example where Vehicle A is in front and Vehicle B is behind, here's how safety distance changes:
| Vehicle A Speed | Vehicle B Speed | Safety Distance of Vehicle B |
|---|---|---|
| Maintains | Decreases | Increases |
| Increases | Maintains | Increases |
| Increases | Decreases | Increases |
| Maintains | Increases | Decreases |
| Decreases | Maintains | Decreases |
| Decreases | Increases | Decreases |
| Maintains | Maintains | Maintains |
| Increases | Increases | Maintains |
| Decreases | Decreases | Maintains |
Note: In the last two cases where speed decreases or increases for both vehicles, the safety distance of Vehicle B only remains the same if the speed reduction or increase is exactly the same for both vehicles.